Förderjahr 2020 / Project Call #15 / ProjektID: 5158 / Projekt: Web of AI
Author: Adriano Barbosa da Silva, PhD.
Papers With Code (PWC) provides a vast collection of papers describing machine learning methods, their underlying code and evaluation tables with the results of ML methods against several benchmarks. As part of the netidee Web of AI project, we process and curate these data ito build the Intelligence Task Ontology (ITO), which allows for gaining a new understanding of the AI development landscape.
The PWC data is organized as a set of Tasks (e.g.: Natural Language Inference), where different Datasets (e.g.: SNLI) are used as benchmarks to test the efficiency of machine learning Models (e.g.: EFL). Results for such tests are Values (e.g.: 93.1) achieved for different Metrics (e.g.: Accuracy) collected at a specific Date (e.g.: 2021-03).
In a specific time frame, let’s say 10 years, the same dataset might be used as benchmark for multiple models, as well as, at multiple tasks. Some models might perform better (i.e.: achieve higher Accuracy values) than their earlier counterparts, setting new state-of-the-art (SOTA) results. Finally, all models that are compared against the same dataset are reported by papers with code as an Evaluation Table, where it is possible to rank them according to a specific metric value.
We are interested to explore the gains in terms of evaluation metrics such as accuracy over the course of years among the tasks. Let's take as proof of principle the Natural Language Processing group, which consists of 115 tasks and 385 unique different benchmarks. For those benchmarks, a total of 705 artificial intelligence models have been evaluated and values for 175 different metrics have been reported by PWC.
In order to provide a compact view of this gain trajectory, we compressed the results achieved per each task as the following:
- First, we flattened the PWC’s leaderboard curve as a horizontal trajectory showing the ratio of the gain from one SOTA to the next per metric and per task;
- Second, we averaged the values of the same metrics across different models collected at the same date (year, month);
- Third, we averaged the values across metrics for the same task collected at the same date (year, month);
- Fourth, we excluded the first reported result per trajectory (the so called anchor). This value tends to mislead the subsequent gains in the trajectory when we aim cross comparison among tasks;
- Fifth, we excluded tasks that after the above aggregations didn’t display at least 2 data points to form a trajectory;
- Sixth, we normalized each trajectories’ data point value relative to the sum of all points’ values in such a trajectory;
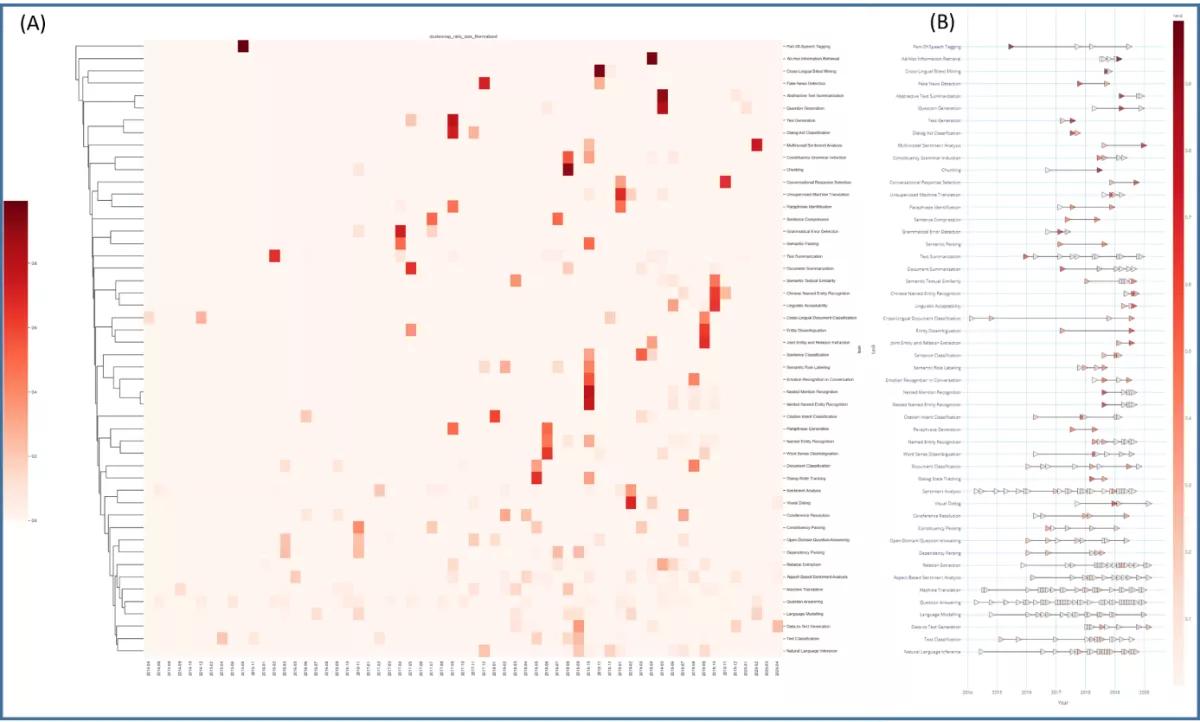
- Seventh, we clustered the established trajectories based on Euclidean distance, and displayed the results as a heatmap (Figure 1A). The labels of the clustered table, were used to reorder the trajectory plot as displayed in Figure 1B.
The result (Figure 1) shows that there are different clusters of machine learning tasks, which can be clustered according to the patterns seen in terms of longitudinal gains in performance in the last years.

Figure 1: Natural Language Processing (NLP) AI tasks trajectory analysis. A) Heatmap showing the distances among different NLP tasks (y-axis) using the normalized averaged ratio of gain along steps of the individual trajectories (x-axis). B) Graphical representation of the trajectories per NLP task; note the existence of a more granular group in the bottom of the figure, as in comparison to a lesser in the top. Scales bot in A and B represent the value for the normalized averaged ratio of gain along steps. Anchor points and trajectories with only one data point are removed from the plot.


