Förderjahr 2023 / Stipendien Call #18 / ProjektID: 6885 / Projekt: Increasing Trustworthiness of Edge AI by Adding Uncertainty Estimation to Object Detection
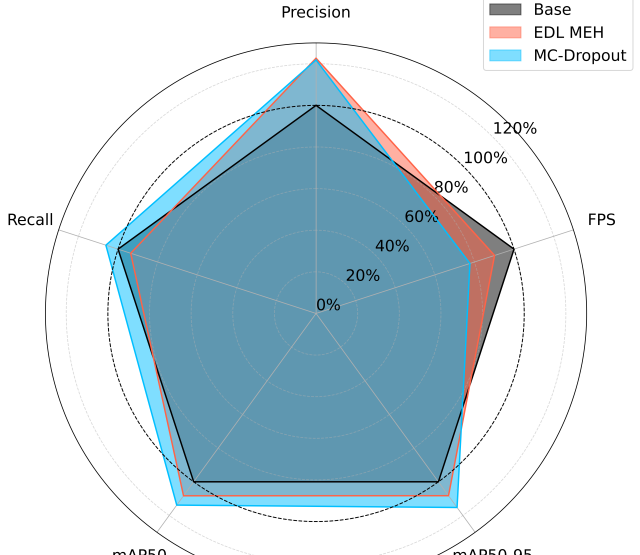
When adding uncertainty estimation to object detection, we need to make sure that these new modifications do not degrade the performance of the base model. Therefore, we evaluate the Precision-Recall curve and its mean Average Precision.
The Outputs of the Model
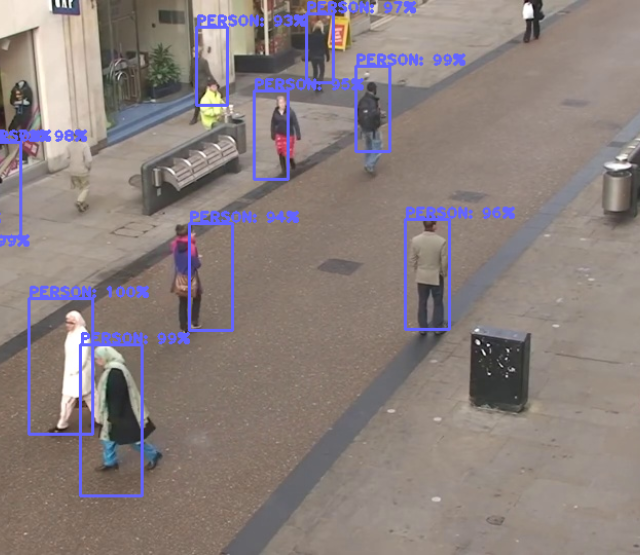
Given an input image, the basic output of object detection is a list of found objects, each described by:
- One class label (the type of object, e.g., "Person")
- One classification score (the likelihood of it being this object type, e.g., 80%)
- Four values describing the bounding box location and dimensions (where the object is in the image, e.g., (150, 100, 200, 200))
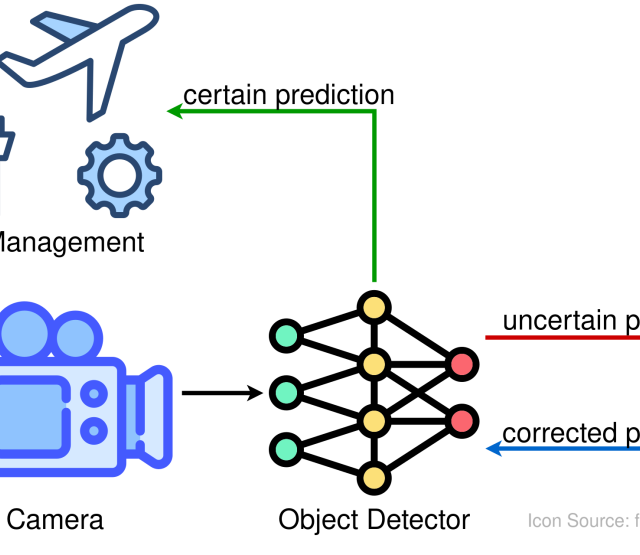
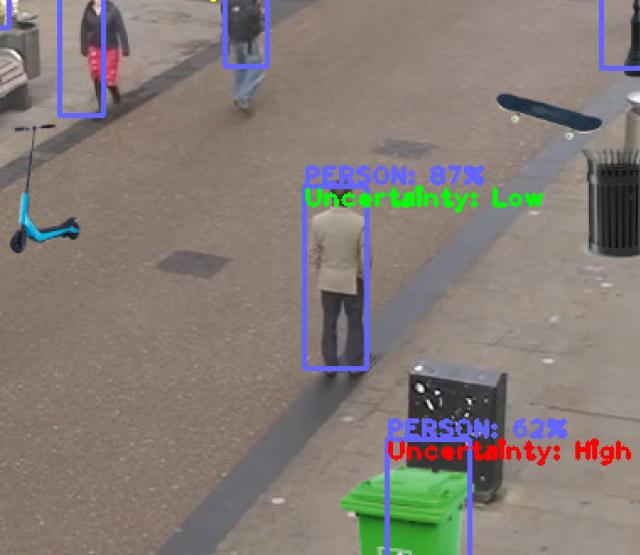
Estimating uncertainty can help make predicted values more trustworthy by allowing the model to express how certain it is after making a prediction. We can estimate the uncertainty for both the classification scores and the bounding box coordinates. This work will focus primarily on the uncertainty of the classification score, as mistakes here are easy to notice (e.g., assigning a "Person" label to a car object) and can have a severe impact in a smart traffic use-case scenario. By adding an uncertainty estimation, we obtain an additional uncertainty score, which is in the same range as the classification score (0-100%).
Metrics for Object Detection
The question is how we can evaluate the quality of such an uncertainty estimate. A common metric for object detection is the mean Average Precision (mAP). The mAP score generally describes how well the model performs in recognizing objects of a certain class, which will be illustrated at the end of this blog. More precisely, the score is based on the values for Precision and Recall [1]:
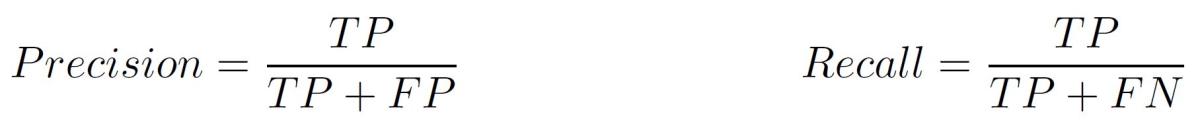
True positives (TP) are objects identified with the correct label and the correct position within the image (granted some tolerance). In contrast, false positives (FP) are predicted objects with incorrect class labels or locations. True negatives (TN) are all possible places in an image without an object, where the detector also predicts that no objects are present. Theoretically, there are countless possible TNs in an image with all possible shapes, positions and classes. However, common prediction models only have a limited number of detectors, such as the Single Shot MultiBox Detector (SSD) with 8732 detectors in the original configuration [2], of which typically only a few find actual objects and the rest mostly report TNs (empty image background). Finally, false negatives (FN) are overlooked objects where no predictions were made. Intuitively speaking, precision measures how many of the predictions of the object detection model turned out to be correct, and recall shows how many of the total objects present in the image were found.
As the predicted objects never completely match the actual object in the image, a tolerance threshold must be used. Therefore, if the found object has the same class label as the actual object with a classification score/probability of at least 50% and overlaps at least half of the ground truth bounding box area (Intersection over Union (IoU)), then it can be considered a successfully predicted object (TP). Since we now also have an uncertainty score, we can use a similar threshold as for the classification score, e.g., a predicted object with uncertainty estimate must now also have an uncertainty score of at most 50% to be considered a TP.
Visualizing the Model's Performance
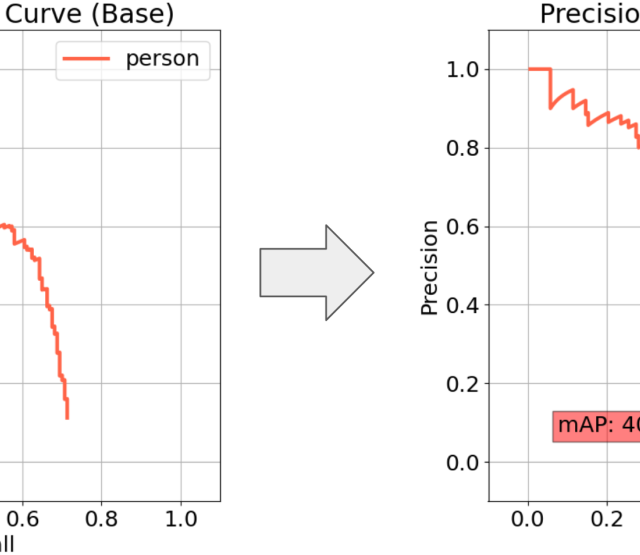
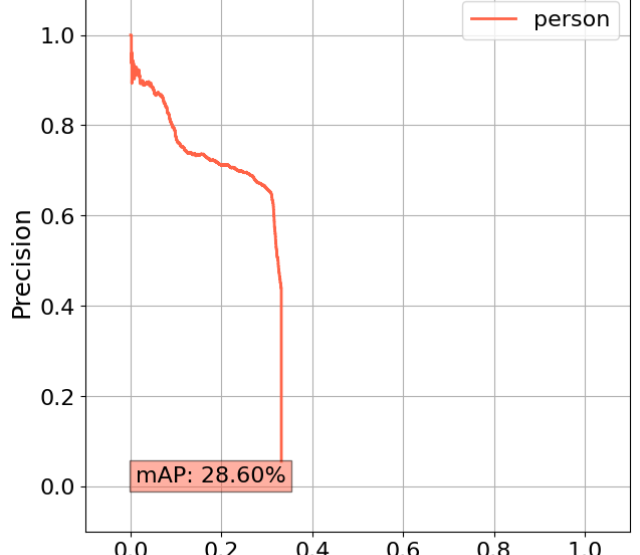
To better visualize the mAP score for evaluation, we can plot the precision-recall graph as shown in the example below:
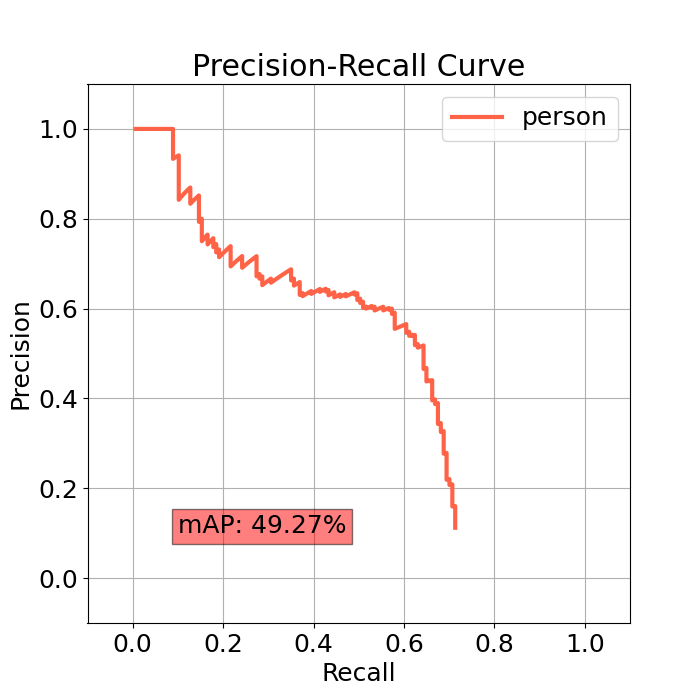
The recall value is shown on the x-axis and the precision on the y-axis. The AP is represented by the area under the curve [3], i.e., the further the curve extends to the top right, the higher the score and the better the model has performed. Each class to be detected has its own AP curve, with the mAP being the mean of all AP values. The curve also shows that the higher the recall (finding all objects in the image), the lower the precision (making many false-positive predictions). Therefore, this work investigates the advantages and disadvantages of an object detection model with uncertainty estimation compared to a regular model by looking at the precision-recall curves. Additionally, false positives will be checked in detail, to see if uncertainty estimation can help to reduce them, by having less overconfidence in predictions the model has not been trained to handle.
References
[1] David L Olson and Dursun Delen. Advanced data mining techniques. Springer Science & Business Media, 2008.
[2] Wei Liu, Dragomir Anguelov, Dumitru Erhan, Christian Szegedy, Scott Reed, Cheng-Yang Fu, and Alexander C Berg. Ssd: Single shot multibox detector. In European conference on computer vision, pages 21–37. Springer, 2016.
[3] Mark Everingham and John Winn. The pascal visual object classes challenge 2012 (voc2012) development kit. Pattern Analysis, Statistical Modelling and Computational Learning, Tech. Rep, 8:5, 2011.