Förderjahr 2018 / Project Call #13 / ProjektID: 3803 / Projekt: out-of-tune
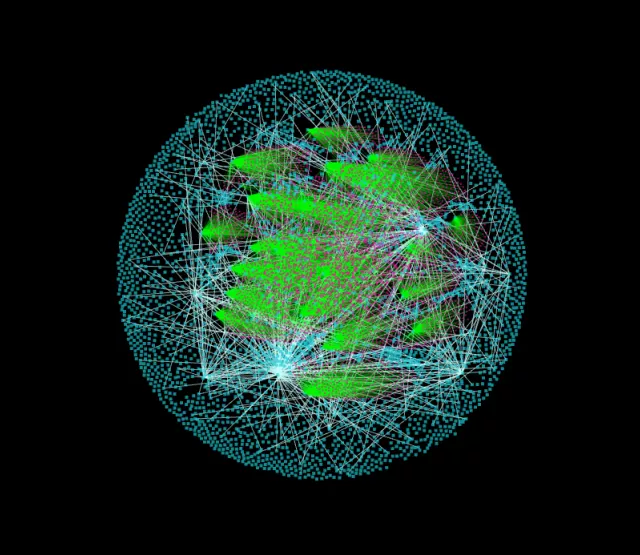
In the music world there is a lot of data. This data can not be displayed all at once.
In order to explore the data in an interactive manner we had to develop a way to only show data that is of interest.
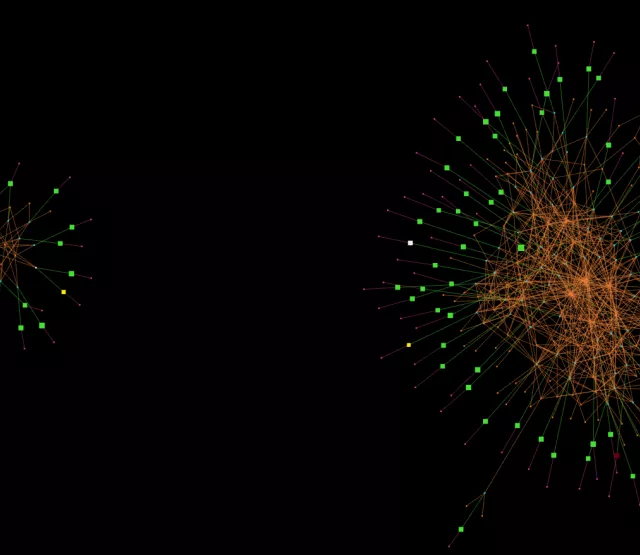
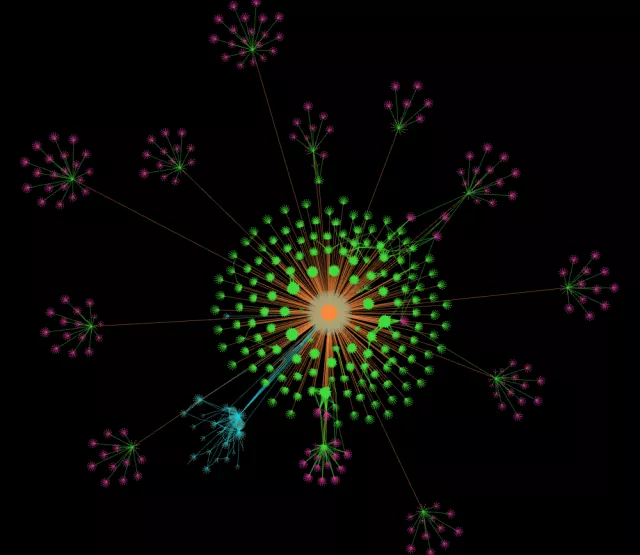
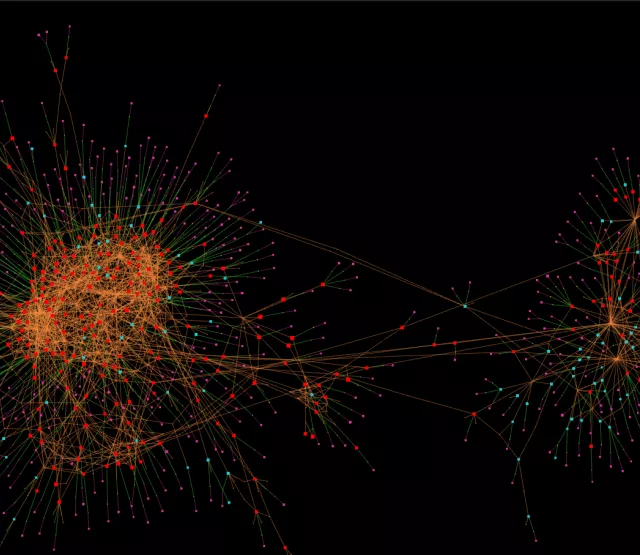
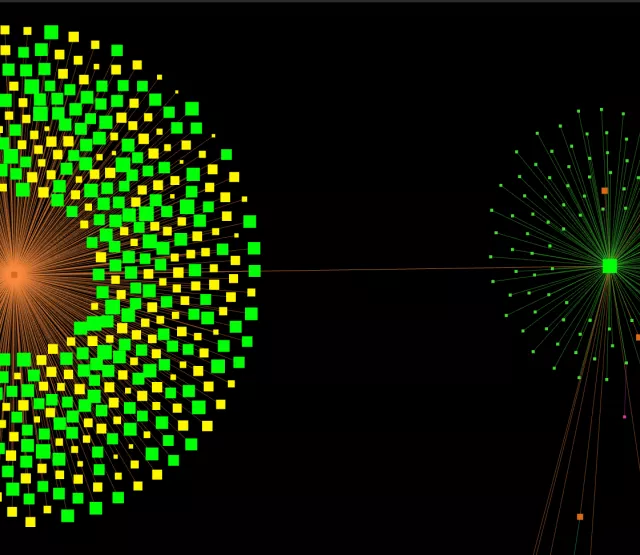
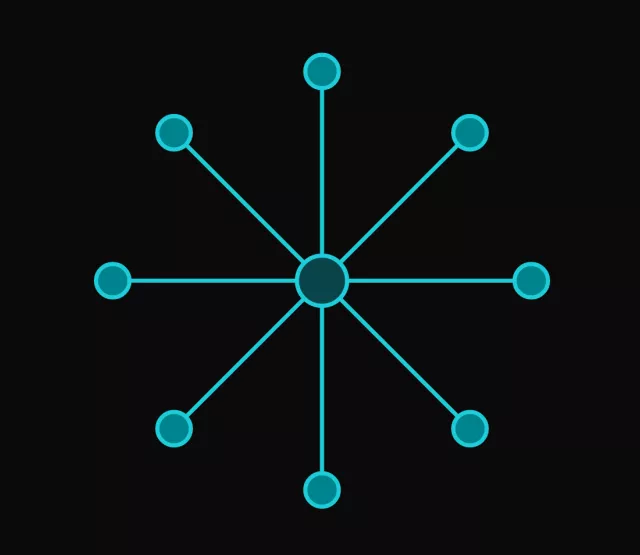
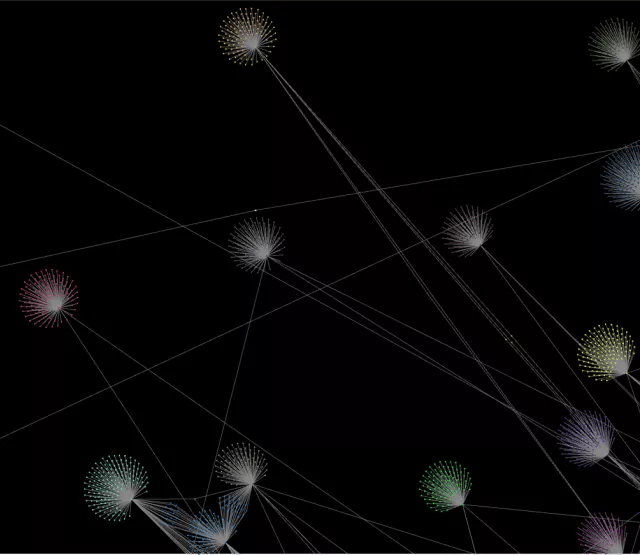
In our case we have a graph consisting of artists and genres which are represented as nodes. The lines represent the relations between these nodes.
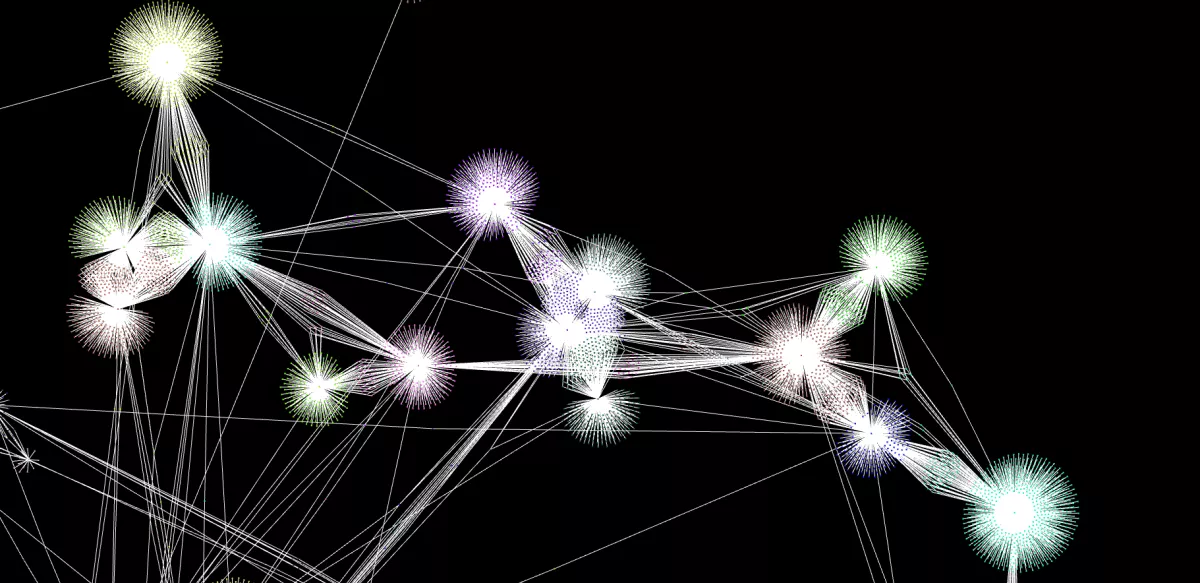
We needed a way to add and remove nodes on demand. The user should be able to control the graph, without having to use needlessly complicated mechanisms. We found that the best way to change the displayed dataset is by clicking on specific nodes.
There are currently two ways a graph can be changed: Nodes can be added by the expand options, and nodes can be deleted by the collapse option. The user can switch between these modes seamlessly.
Expand
At this point of time it is relatively easy to decide which nodes should be added to the graph when one is clicked, because we currently only have two types of nodes: genres and artists. When a genre is clicked, all artists that are connected to this genre appear and vice versa.
In the near future we may have more node types (e.g. albums and songs). Then it is not so clear which nodes should be added. To tackle this problem we have a configuration for the user, so he can decide which connections and corresponding nodes should be added to the graph.
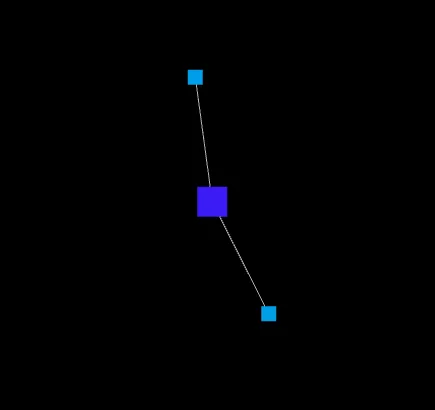
Example: A user clicks on the artist Bob Marley and all connected Genres, in this case "reggae" and "roots reggae" are added to the graph as nodes.

Collapse
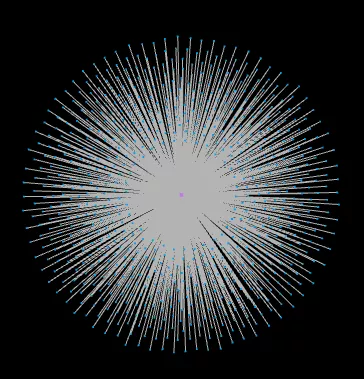
The collapse action is the counterpart to the expand action. It removes all connections between the node and deletes the nodes that now no longer have a connection.
Example: A user clicks on a genre (e.g. reggae) and all connections to this node will be deleted.

Stay tuned!

