Förderjahr 2018 / Project Call #13 / ProjektID: 3803 / Projekt: out-of-tune
Last month we thought about how we could further utilize the strengths of out-of-tune and give our users an interesting way of exploring their already existing music library.
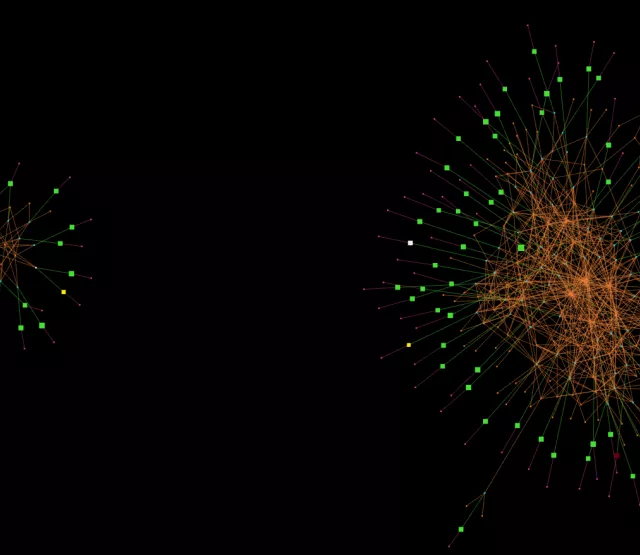
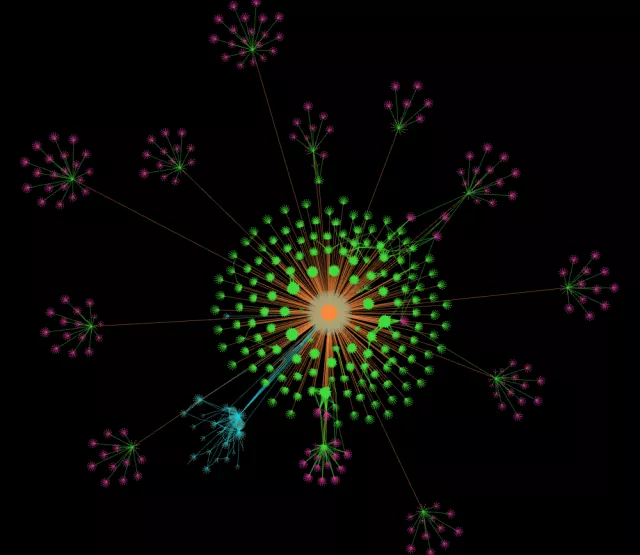
By exploring the possibilities of the Spotify API, we found out that we could rather easily implement a playlist visualization.
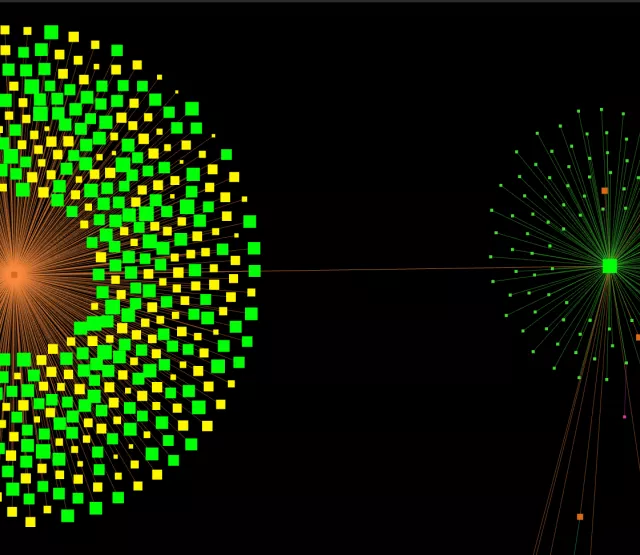
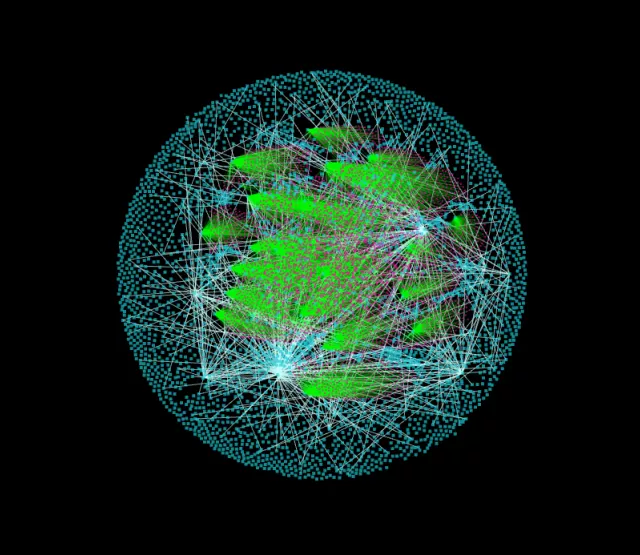
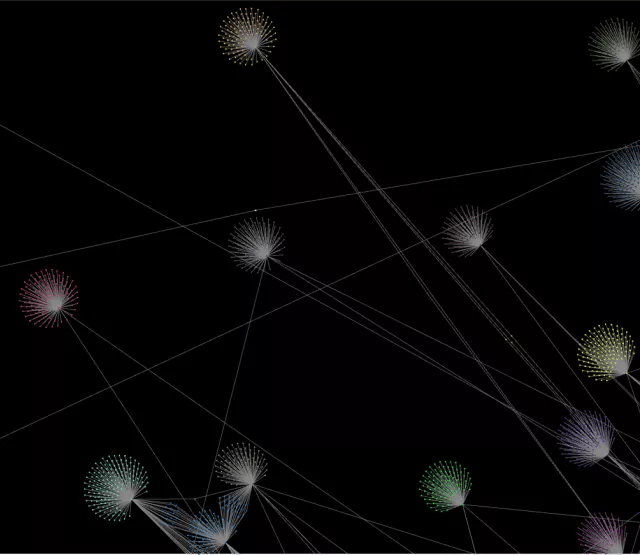
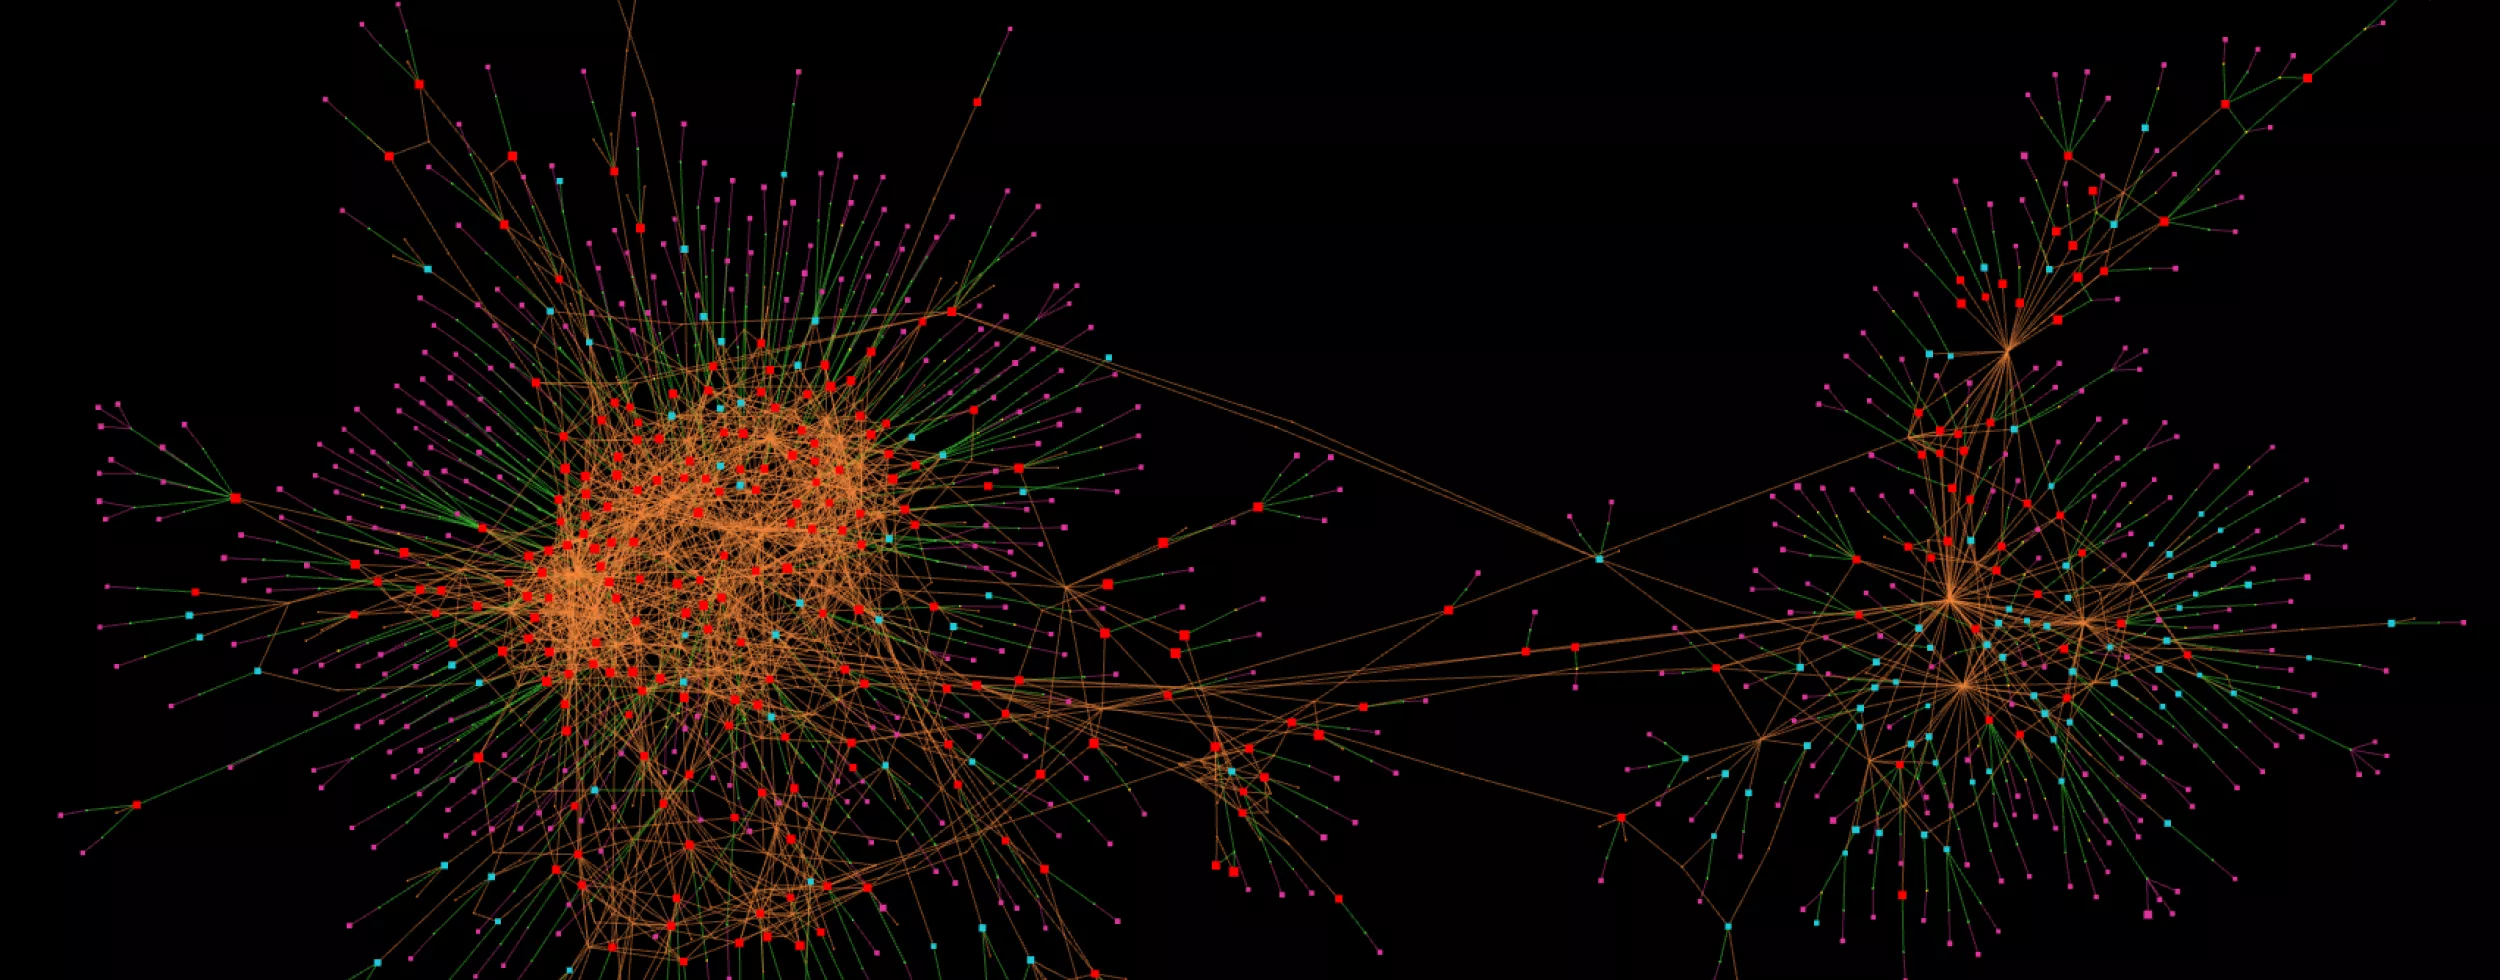
First off, here are some examples how such visualizations looks like:


These visualizations are just as interactive as any other graph in out-of-tune. You can use this visualization as a starting point, to explore the vast world of music (we wrote about starting points in our last blog post)
The best thing is: You can do that with every playlist on Spotify. Take the playlists of your friends and visualize them. Go to the playlists of your favorite artists and visualize them. You can even look at automatically generated lists provided by Spotify.
In combination with different configurations, you can find out many interesting facts about your playlists (or did you expect that this indie playlist only has very popular artists?):


Stay tuned!
P.S.: We are now online with a beta version of out-of-tune, check it out and let us know if you have some ideas for improvement: app.out-of-tune.org

